
Bitcoin Price Analysis: BTC Consolidation Continues, Giant Price Move Imminent
Bitcoin Price Analysis: BTC Consolidation Continues, Giant Price Move Imminent
BTC is down by a minor 1.5% today as it struggles to maintain support area amid $33K. It is trading within a narrow range between $36,000 and $32,000 during the first half of July, and all signs point to an upcoming huge move.

The volume for July has remained painfully low, especially during the last two weekends, which saw the two lowest volume days. This, combined with the drawn-out consolidation period, has many traders waiting for a huge move ahead, which would dictate the next trend and is possible in both directions. However, more signs are bearish than bullish.
This move also has a fundamental cause – the GBTC shares unlock. With the $550 million GBTC shares unlock coming this Sunday, it seems that traders are highly cautious, as evidenced by the low volume. Therefore, it appears that a huge move might not occur until this uncertainty has been resolved.
The bigger picture is the $30K – $42K range, where BTC was trading at since the May-19 price collapse. However, that range had tightened over the past weeks, and Bitcoin is mostly trading around the $32-33K mark.
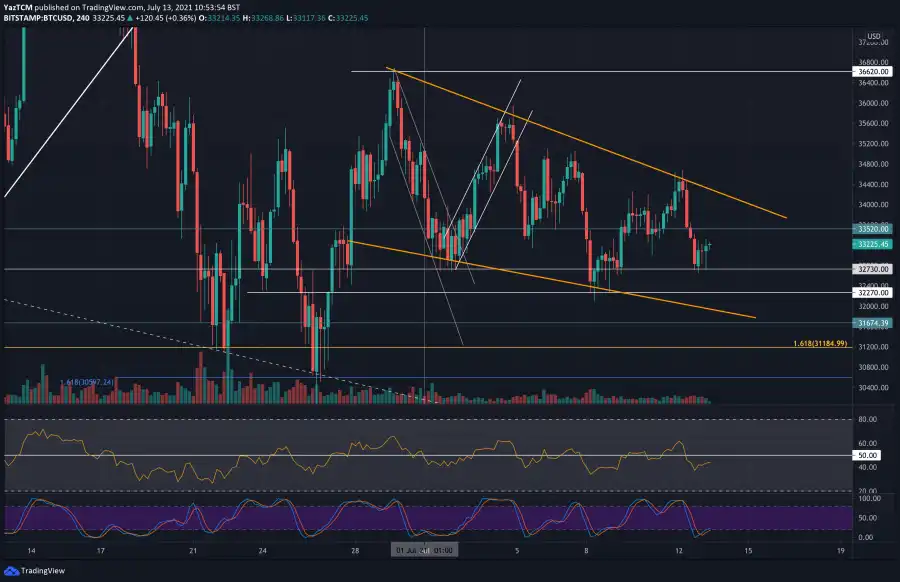
Looking at the following charts, there is a short-term descending price channel which had emerged on the daily chart, spanning the period of July. Additionally, a short-term falling wedge (which might turn into a bullish pattern) can be seen on the following 4-hour charts.
BTC Price Support and Resistance Levels to Watch
Key Support Levels: $32,700, $32,000, $31,500, $31,185, $30,600.
Key Resistance Levels: $33,500, $34,000, $35,500, $36,600, $38,000..
Looking ahead, the first support lies at $32,700, which had provided horizontal support in the first two days of July. This is followed by $32,000, $31,500 (lower angle of the wedge & late June double-bottom daily chart support), $31,185 (downside 1.618 Fib Extension), $30,500, and $30,000.
On the other side, the first resistance lies at $33,500 (early July support turned resistance). This is followed by $34,000 (20-day MA and upper angle of short-term wedge), $35,500 (50-day MA), $36,600 (late-June resistance), $38,000, and $39,500.
The daily RSI remains beneath the midline as it tracks a long-term descending trend line that has prevented the momentum from establishing a higher high since the start of February. For BTC to recover, the RSI must break above this long-term descending trend line, and end this bearish lower highs trajectory.
Bitstamp BTC/USD Daily Chart

Bitstamp BTC/USD 4-Hour Chart

{{comment.anon_name ?? comment.full_name}}
{{timeAgo(comment.date_added)}}
{{comment.body}}
{{subComment.anon_name ?? subComment.full_name}}
{{timeAgo(subComment.date_added)}}
{{subComment.body}}